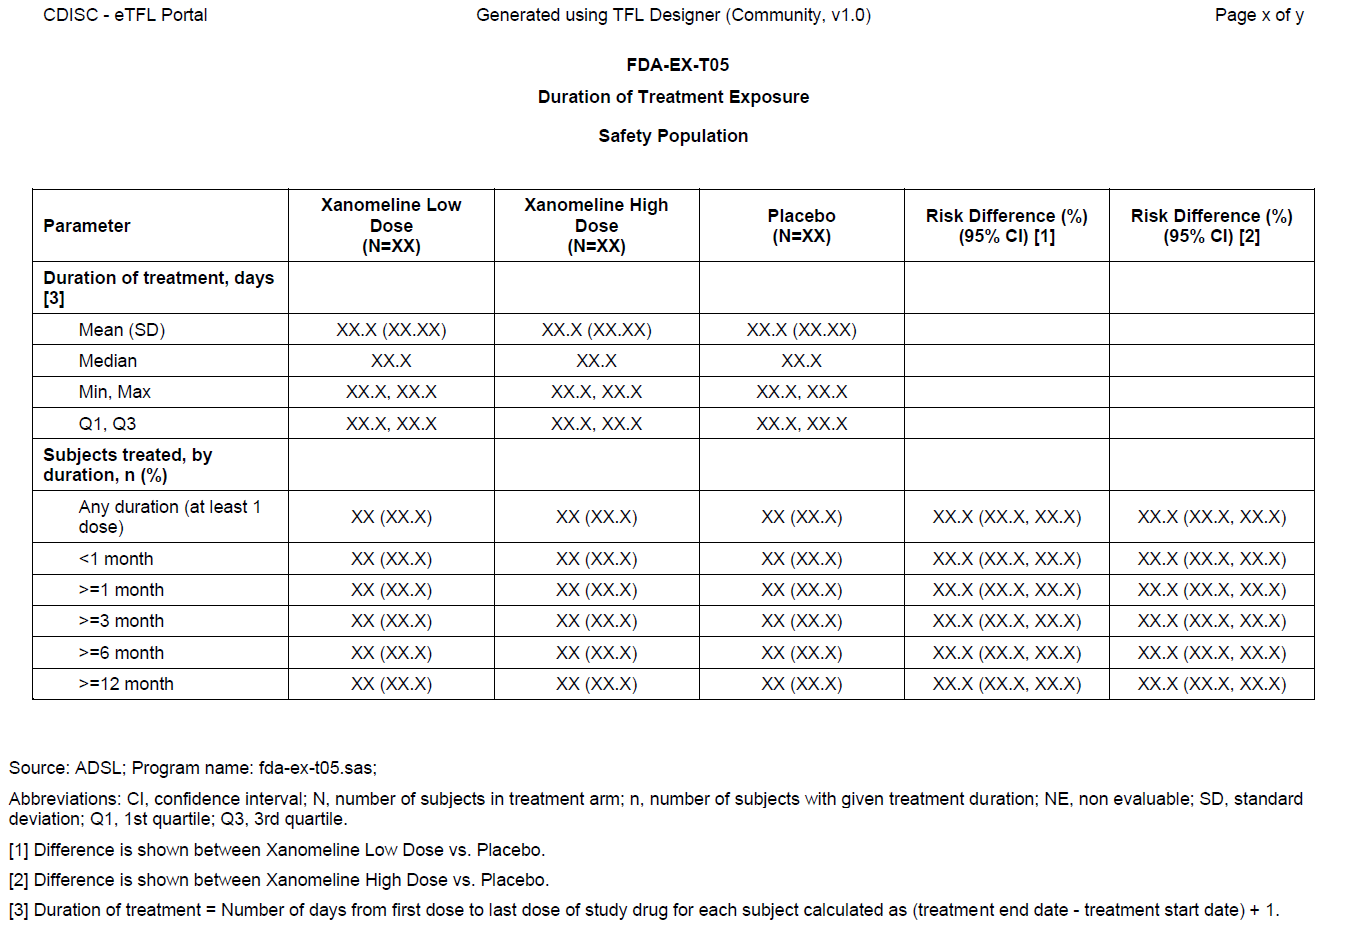
This table shows the duration of treatment in weeks, months, days, cycles as well as the number of patients treated by duration for the safety population.
This display is based on Table 5. Duration of Treatment Exposure from the FDA STANDARD SAFETY TABLES AND FIGURES: INTEGRATED GUIDE (Version Date: August 2022), published by the Center for Drug Evaluation and Research (CDER) Biomedical Informatics and Regulatory Review Science (BIRRS) Team.
This display was created using data from the following ADaM datasets
ADSL
The ADaM datasets from the CDISC Pilot Study were modified as follows
Only variables that were needed to create this display have been retained.
If needed, additional variables were added to support the creation of the display.
The following differences exist between the display shown and the reference display from the FDA Standard Tables and Figures: Integrated Guide
The display shown uses the word "Subject" vs "Patient" to be consistent with the language used in CDISC standards.
The display shows two Risk Differences, one for each dose compared to the placebo.
The display does not show an active control as this does not exist in the CDISC Pilot Study data.
FDA-EX-T05 eTFL Package