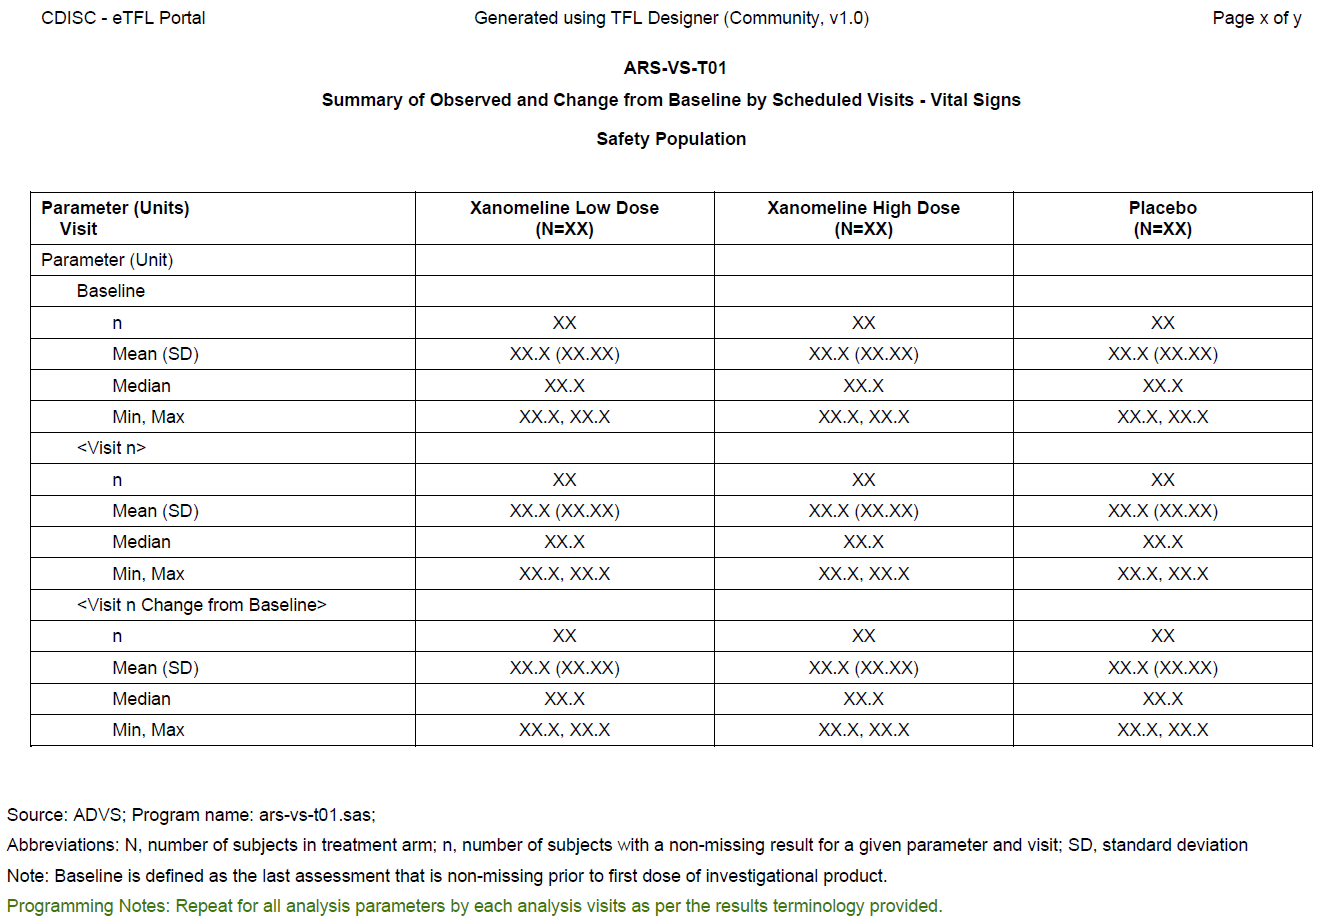
This table shows a summary of observed change from baseline in vital signs measurements by scheduled visits for each treatment group of the safety population. Summary measures include: n, Mean(SD), Median, Min, and Max. This display was created as part of the ARS v1.0 release.
This display was created using data from the following ADaM datasets
ADSL, ADVS
The ADaM datasets from the CDISC Pilot Study were modified as follows
Only variables that were needed to create this display have been retained.
If needed, additional variables were added to support the creation of the display.

Package
ARS-VS-T01 eTFL Package
ARS-VS-T01 eTFL Package